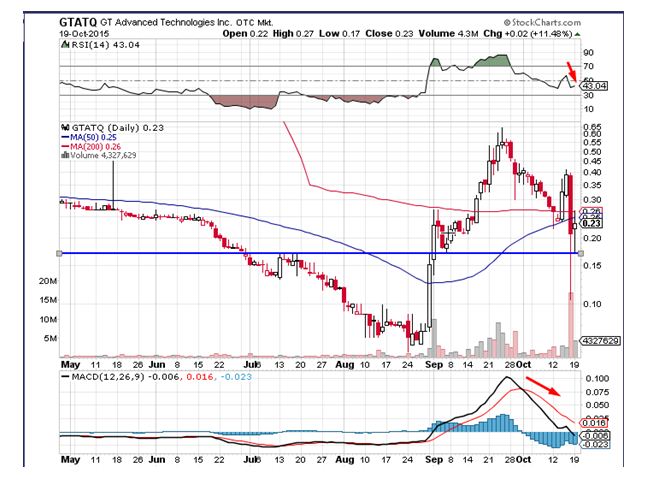
On Monday, the stock price of GT Advanced Technologies Inc (OTCMKTS:GTATQ) gained more than 11% to close the trading session at $0.234. With this the stock managed to recoup a part of its losses recorded on October 16, 2015. Prior to that, the stock had been making small and steady gains after making a new low in September. Currently, the company is active in bankruptcy as a debtor in charge of its assets.
The plans for comeback
GT advanced had received capital from bondholders, lowered costs by 40% and recruited new CEO to give shape to its restructuring plans. A couple of months ago, the company announced that it is reducing headcount and cutting operating costs under restructuring process. GT Advanced acquired a term loan facility of $95 million from bond holders. It intends to simplify its cost structure and implement new strategic plan in order to emerge from bankruptcy early next year.
The focus
GT Advanced provided an insight into its new business plan. The company reported that the revised business plan will be more focused on the expansion of its core technologies and products. It will cover all the major segments including ASF(R) sapphire equipment division, DSS solar PV and polysilicon operations, the commercialization of the ‘Merlin cell interconnect’ and specialty sapphire materials business.
The future ahead
In addition to commercialization measures of ASF equipment, the company is planning to take essential measures for completion of solar PV products. It will help it to capitalize on increased demand from customers as the segment had witnessed strong growth in last two years. At the same time, GT Advanced is assessing its other operations to identify their strategic importance and how it could benefit from them after it emerges from bankruptcy. These measures will have an impact on all functions and locations of GT Advanced’s worldwide business operations.
GT Advanced Technologies Inc (OTCMKTS:GTATQ) has been in a strong downtrend over the last week and is currently seeking support near the levels of $0.16. The momentum indicators for the stock have given a sell signal and are showing no signs of a reversal which is a bearish sign. The stock currently trades below all important daily moving averages which is a negative sign. Traders believe the stock could head to levels of $0.10 if it breaks down below the above mentioned support zone. Traders believe the stock would find resistance near the $0.25 level on the upside in the near term


